Daily bit(e) of C++ | Optimizing code to run 87x faster
Daily bit(e) of C++ #474, Optimizing C++ code to run 87x faster for the One Billion Row Challenge (1brc).
The One Billion Row Challenge was initially a challenge for Java developers. The goal was to develop and optimize a parser for a file containing one billion records.
While the original challenge was for Java, this challenge is an excellent opportunity to demonstrate the optimization of C++ code and the related performance tools.
The challenge
Our input is a file called measurements.txt, which contains temperature measurements from various measurement stations. The file contains exactly one billion rows with the following format:
station name;value
station name;value
The station name is a UTF-8 string with a maximum length of 100 bytes, containing any 1-byte or 2-byte characters (except for ‘;’ or ‘\n’). The measurement values are between -99.9 and 99.9, all with one decimal digit. The total number of unique stations is limited to 10’000.
The output (to stdout) is a lexicographically sorted list of stations, each with the minimum, average and maximum measured temperature.
{Abha=-23.0/18.0/59.2, Abidjan=-16.2/26.0/67.3, Abéché=-10.0/29.4/69.0, ...}Baseline implementation
Naturally, we have to start with a baseline implementation. Our program will have two phases: processing the input and formatting the output.
For the input, we parse the station name and the measured value and store them in a std::unordered_map.
To produce the output, we collate the unique names, sort them lexicographically and then print out the minimum, average and maximum measurements.
We are left with a straightforward main function that plugs both parts together.
This baseline implementation is very simple, but sadly, it has two major problems: It’s not correct (we will ignore that detail for now), and it's very, very slow. We will be tracking the performance across three machines:
Intel 9700K on Fedora 39
Intel 14900K on Windows Subsystem for Linux (WSL)
Mac Mini M1 (8-core)
The binaries are compiled using clang 17 on the 9700K, clang 18 on the 14900K and Apple clang 15 on the Mac Mini. All three machines use the same compilation flags:
-O3 -march=native -g0 -DNDEBUG -fomit-frame-pointerSince we mainly care about the relative performance progression, the measurements are simply the fastest run on the corresponding machine.
9700K (Fedora 39): 132s
14900K (WSL Ubuntu): 67s
Mac Mini M1: 113s
Eliminating copies
We don’t need special tooling for the first change. The most important rule for high-performance code is to avoid excessive copies. And we are making quite a few.
When we process a single line (and remember, there are 1 billion of them), we read the station name and the measured value into a std::string. This inherently introduces an explicit copy of the data because when we read from a file, the content of the file is already in memory in a buffer.
To eliminate this issue, we have a couple of options. We can switch to unbuffered reads, manually handle the buffer for the istream or take a more system-level approach, specifically memory mapping the file. For this article, we will go the memory-map route.
When we memory-map a file, the OS allocates address space for the file’s content; however, data is only read into memory as required. The benefit is that we can treat the entire file as an array; the downside is that we lose control over which parts of the file are currently available in memory (relying on the OS to make the right decisions).
Since we are working with C++, let’s wrap the low-level system logic in RAII objects.
Because we are wrapping the memory-mapped file in a std::span, we can validate that everything still works by simply swapping std::ifstream for std::ispanstream.
While this validates that everything still works, it doesn’t remove any excessive copies. To do that, we have to switch the input processing from operating on top of an istream to treating the input as one big C-style string.
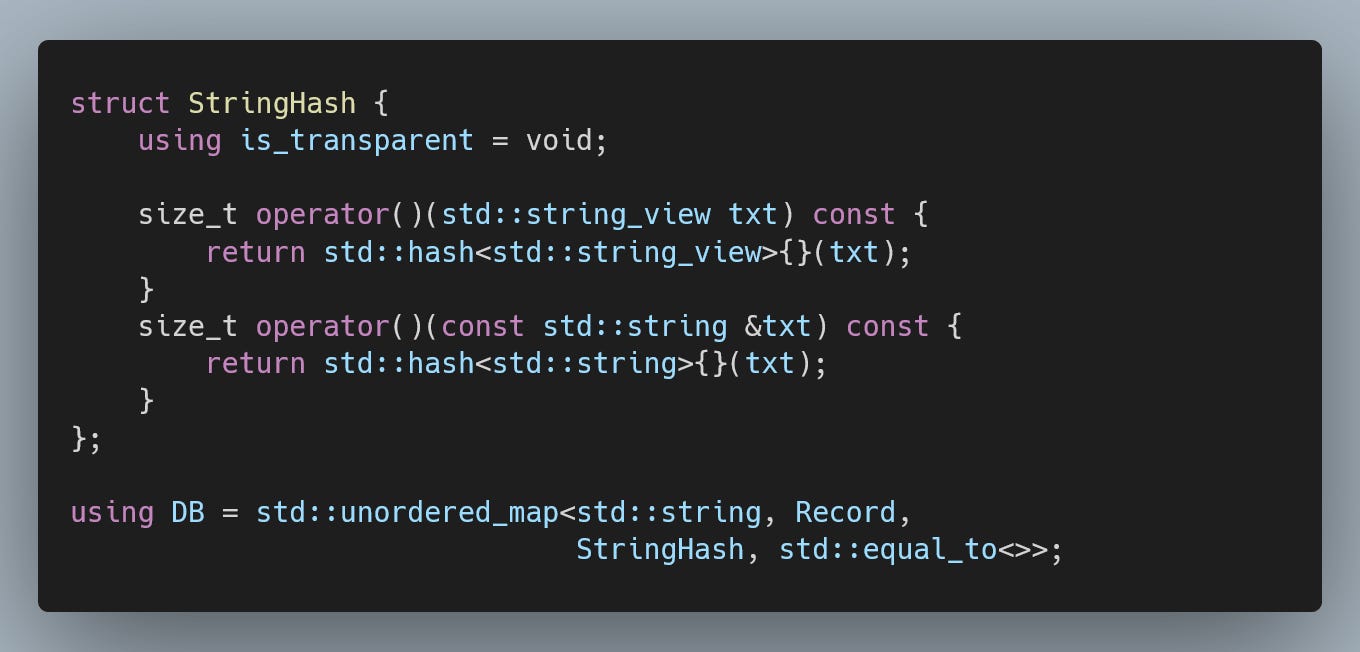
We must adjust our hash map to support heterogeneous lookups because we now look up the stations using a std::string_view. This involves changing the comparator and adding a custom hasher.
This makes our solution run much faster (we are skipping over M1 for now since clang 15 doesn’t support std::from_chars for floating point types).
9700K (Fedora 39): 47.6s (2.8x)
14900K (WSL Ubuntu): 29.4s (2.3x)
Analyzing the situation
To optimize the solution further, we have to analyze which parts of our solution are the main bottlenecks. We need a profiler.
When it comes to profilers, we have to choose between precision and low overhead. For this article, we will go with perf, a Linux profiler with extremely low overhead that still provides reasonable precision.
To have any chance to record a profile, we have to inject a bit of debugging information into our binary:
-fno-omit-frame-pointer # do not omit the frame pointer
-ggdb3 # detailed debugging information
To record a profile, we run the binary under the perf tool:
perf record --call-graph dwarf -F999 ./binaryThe callgraph option will allow perf to attribute low-level functions to the correct caller using the debug information stored in the binary. The second option decreases the frequency at which perf captures samples; if the frequency is too high, some samples might be lost.
We can then view the profile:
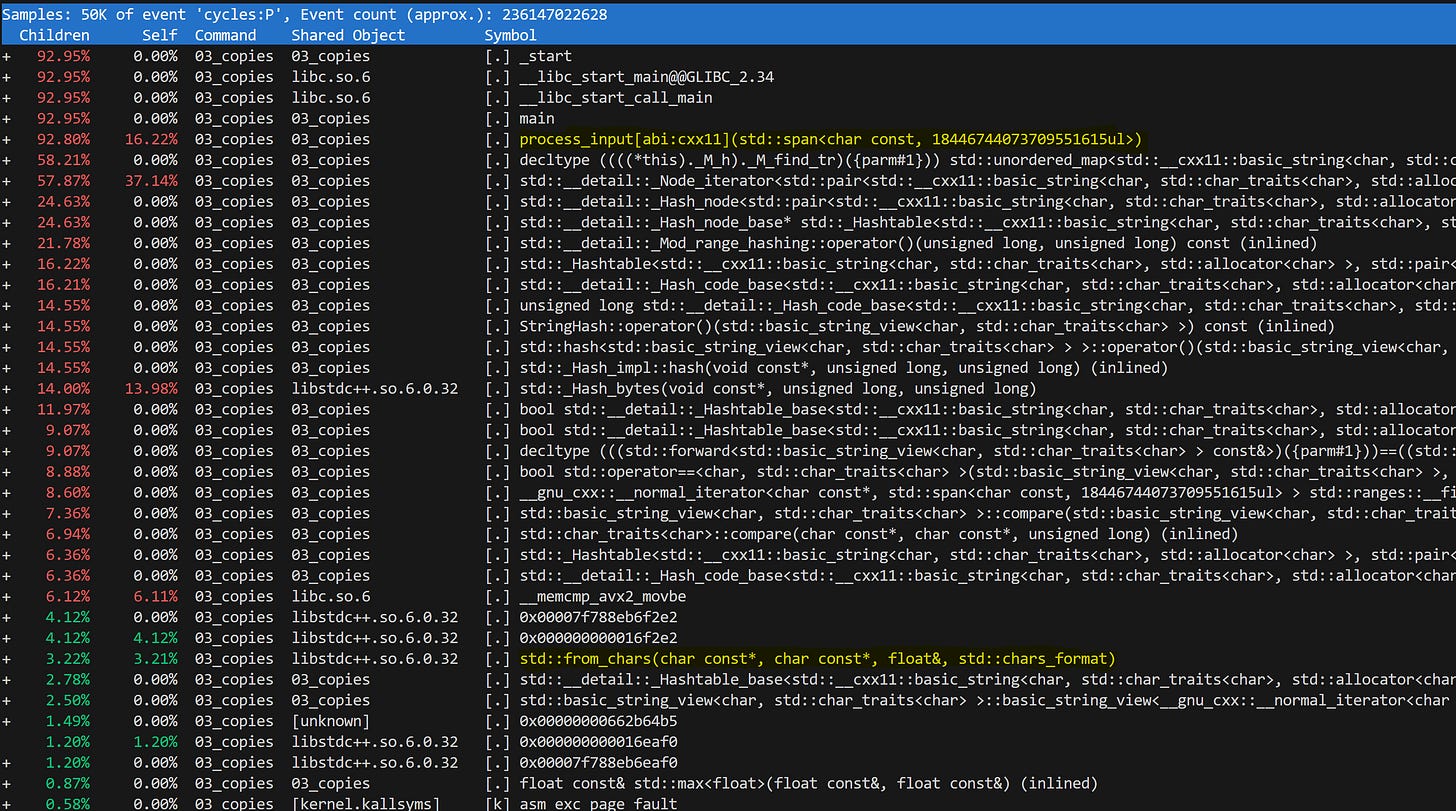
perf report -g 'graph,caller'However, if we run perf on the current implementation, we get a profile that isn’t particularly informative.
We can deduce that the biggest portion of the runtime is spent in the std::unordered_map. However, the rest of the operations are lost in the low-level functions. For example, you might conclude that parsing out the measured values only takes 3% (the std::from_chars function); this would be an incorrect observation.
The profile is poor because we have put all the logic into a single tight loop. While this is good for performance, we completely lose the sense of the logical operations we are implementing:
parse out the station name
parse out the measured value
store the data in the database
Profile clarity will drastically improve if we wrap these logical operations into separate functions.
Now, we can see that we are spending 62% of our time inserting data into our database, 26% parsing the measured values, and 5% parsing the station names.
We will address the hash map, but before that, let’s deal with parsing the values. This will also fix a persistent bug in our code (bad rounding).
Integers in disguise
The input contains measurements from the range -99.9 to 99.9, always with one decimal digit. This means that we are not dealing with floating-point numbers in the first place; the measured values are fixed-point numbers.
The proper way to represent fixed-point values is as an integer, which we can manually parse (for now, in a straightforward way).
This change also propagates to the record structure.
Database insertion can remain the same, but we can take the opportunity to optimize the code slightly.
Finally, we have to modify the output formatting code. Since we are now working with fixed-point numbers, we have to correctly convert and round the stored integer values back to floating point.
This change fixes the aforementioned rounding bug and improves the runtime (floating-point arithmetic is slow). The implementation is also compatible with the M1 Mac.
9700K (Fedora 39): 35.5s (3.7x)
14900K (WSL Ubuntu): 23.7s (2.8x)
Mac Mini M1: 55.7s (2.0x)
Custom hash map
The std::unordered_map from the standard library is notorious for being slow. This is because it uses a node structure (effectively an array of linked lists of nodes). We could switch to a flat map (from Abseil or Boost). However, that would be against the original spirit of the 1brc challenge, which prohibited external libraries.
More importantly, our input is very constrained. We will have at most 10k unique keys for 1B records, leading to an exceptionally high hit ratio.
Because we are limited to 10k unique keys, we can use a linear probing hash map based on a 16-bit hash that directly indexes a statically sized array. We use the next available slot when we encounter a collision (two different stations map to the same hash/index).
This means that in the worst case (when all stations map to the same hash/index), we end up with a linear complexity lookup. However, that is exceptionally unlikely, and for the example input using std::hash, we end up with 5M collisions, i.e. 0.5%.
This change results in a sizeable speedup.
9700K (Fedora 39): 25.6s (5.1x)
14900K (WSL Ubuntu): 18.4s (3.6x)
Mac Mini M1: 49.4s (2.3x)
Micro-optimizations
We have cleared up the high-level avenues of optimizations, meaning it is time to dig deeper and micro-optimize the critical parts of our code.
Let’s review our current situation.
We can potentially make some low-level optimizations in hashing (17%) and integer parsing (21%).
The correct tool for micro-optimizations is a benchmarking framework. We will implement several versions of the targetted function and compare the results against each other.
For this article, we will use Google Benchmark.
Parsing integers
The current version of integer parsing is (deliberately) poorly written and has excessive branching.
We can’t properly make use of wide instructions (AVX) since the values can be as short as three characters. With wide instructions out of the way, the only approach that eliminates branches is a lookup table.
As we parse the number, we have only two possible situations (ignoring the sign):
we encounter a digit: multiply the accumulator by 10 and add the digit value
we encounter a non-digit: multiply the accumulator by 1 and add 0
We can encode this as a 2D compile-time generated array that contains information for all 256 values of a char type.
We can plug these two versions into our microbenchmark and get a very decisive result.
Sadly, the previous sentence is a lie. You cannot just plug the two versions into Google Benchmark. Our implementation is a tight loop over (at most) 5 characters, which makes it incredibly layout-sensitive. We can align the functions using an LLVM flag.
-mllvm -align-all-functions=5However, even with that, the results fluctuate heavily (up to 40%).
Hashing
We have two opportunities for optimization when it comes to hashing.
Currently, we first parse out the name of the station, and then later, inside lookup_slot, we compute the hash. This means we traverse the data twice.
Additionally, we compute a 64-bit hash but only need a 16-bit one.
To mitigate the issues we run into with integer parsing, we will merge the parsing into a single step, producing a string_view of the station name, a 16-bit hash and the fixed-point measured value.
We use a simple formula to calculate the custom 16-bit hash and rely on unsigned overflow instead of modulo.
This provides a nice speedup (with reasonable stability).
And when we plug this improvement into our solution, we get an overall speedup.
9700K (Fedora 39): 19.2s (6.87x)
14900K (WSL Ubuntu): 14.1s (4.75x) (noisy)
Mac Mini M1: 46.2s (2.44x)
Unleash the threads
If we investigate the profile now, we will see that we are reaching the limit of what is feasible.
There is very little runtime left outside of the parsing (which we just optimized), slot lookup and data insertion. So naturally, the next step is to parallelize our code.
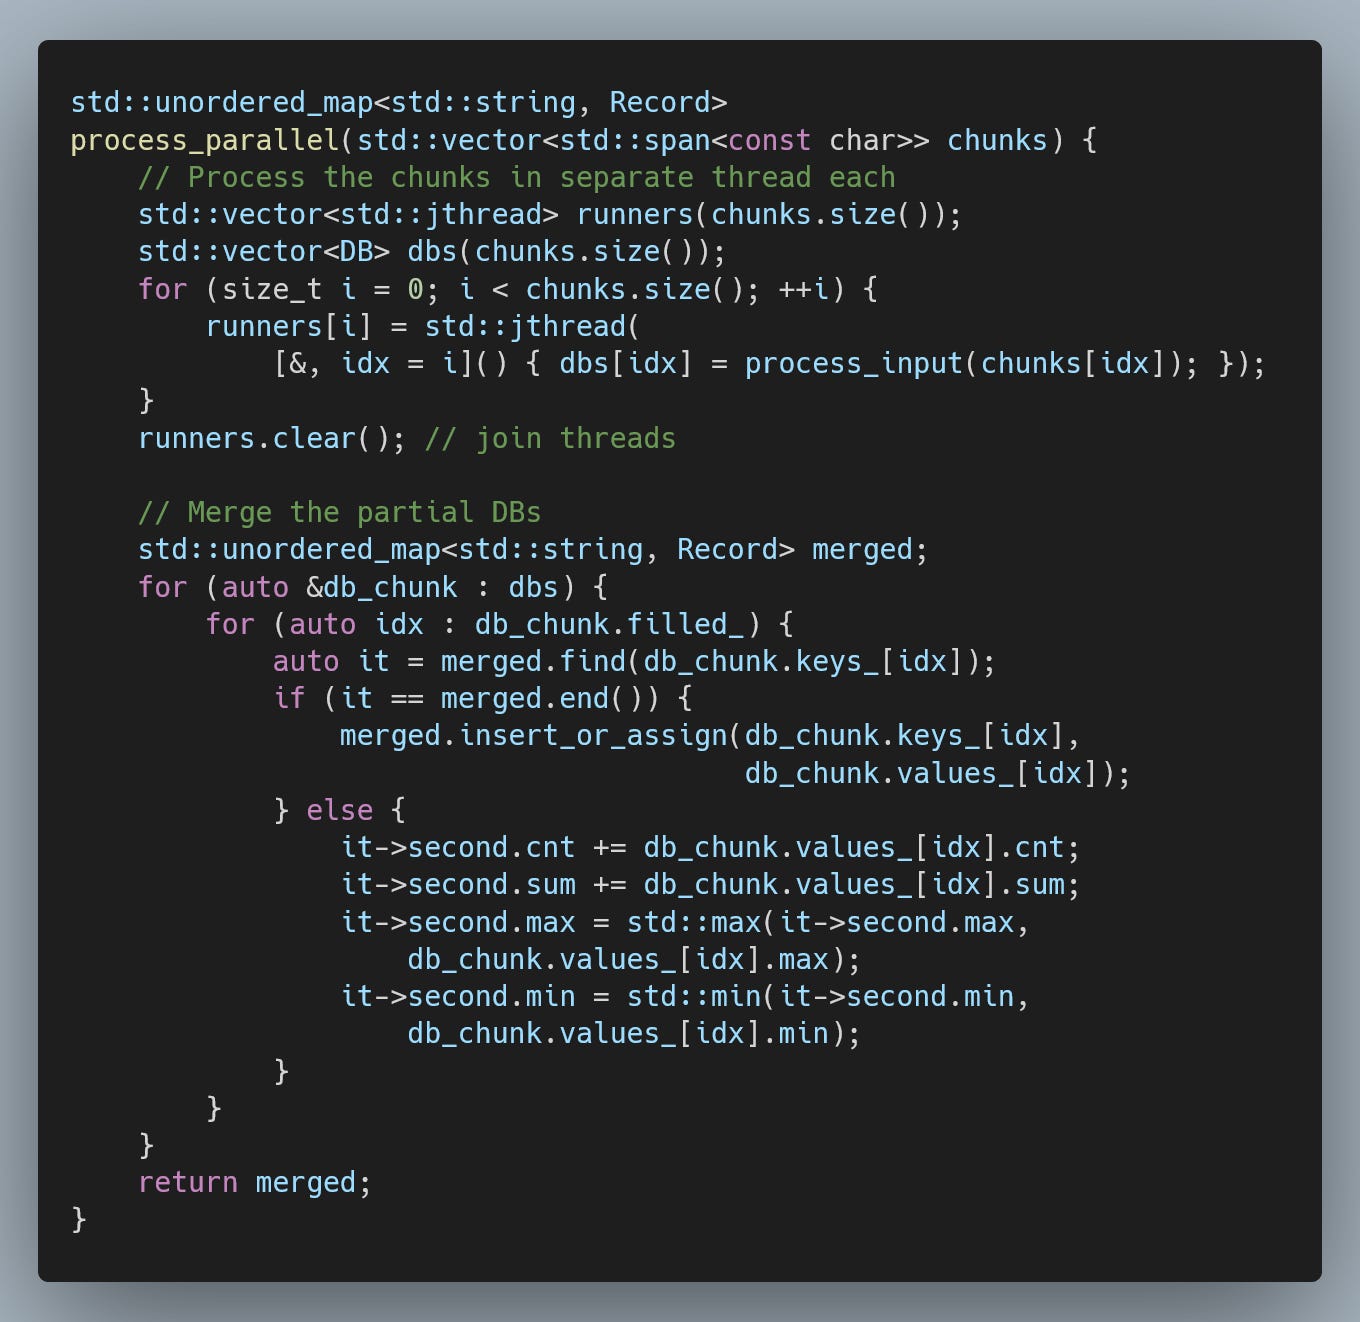
The simplest way to achieve this is to chunk the input into roughly identical chunks, process each chunk in a separate thread and then merge the result.
We can extend our MappedFile type to provide chunked access.
We can then simply run our existing code per chunk, each in its own thread.
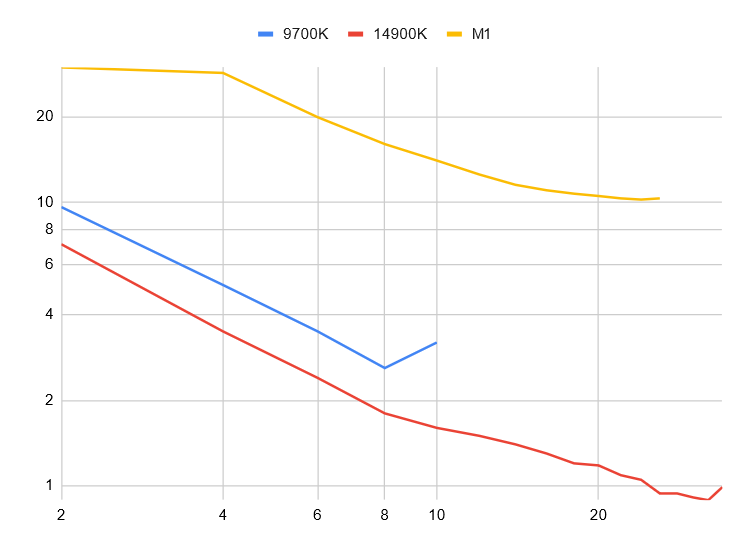
This gives a fairly nice scaling.
The following are the best results. Note that these are just best runs for relative comparison, not a rigorous benchmark.
9700K (Fedora 39): 2.6s (50x) (on 8 threads)
14900K (WSL Ubuntu): 0.89s (75x) (on 32 threads)
Mac Mini M1: 10.2s (11x) (on 24 threads)
Dealing with asymmetric processing speeds
The 9700K scales extremely cleanly, but that is because this processor has 8 identical cores that do not support hyperthreading. Once we move on to 14900K, the architecture gets a lot more complicated with performance and efficiency cores.
If we trivially split the input into identical chunks, the efficiency cores will trail behind and slow the overall runtime. So, instead of splitting the input into chunks, one for each thread, let’s have the threads request chunks as needed.
And the corresponding next_chunk method in our MappedFile.
Which allows us to squeeze the last bit of performance from the 14900K.
14900K (WSL Ubuntu): 0.77s (87x) (on 32 threads)
Conclusion
We have improved the performance of our initial implementation by 87x, which is definitely not insignificant. Was it worth it?
Well, that depends. This article has taken me a long time to write and has cost me a chunk of my sanity. Notably, the alignment issues when using microbenchmarks were a huge pain to overcome.
If I were optimizing a production piece of code, I would likely stop at the basic optimizations (and threads). Micro-optimizations can be worthwhile, but the time investment is steep, and the stability of these optimizations on modern architectures is very poor.
The full source code is available in this GitHub repository.


Wow! Definitely à superb work you've done here! Thanks for sharing this!
This was really interesting, thanks for writing it!